HIV Incidence
Using unweighted data, 12,357 of pre-cohort participants tested as HIV-uninfected and were thus eligible for enrollment in the incidence cohort, Cohort 1 (Note: eligible participants were individuals who tested uninfected by rapid testing and by NAAT). Of eligible participants, 11,880 (96%) were enrolled and 477 (4%) refused. Among this enrolled cohort, 11,155 (94%) completed follow-up and 10,924 (88%) received HIV testing at the follow-up visit.
Table 1: Demographic Characteristics of HIV-uninfected Adults in Swaziland, by Gender*
| Total | Men | Women | ||||
|---|---|---|---|---|---|---|
| Overall Number | 11840 | 6025 | 5815 | |||
| Age, mean (years) | 28.3 | 27.4 | 29.3 | |||
| Rural dweller | 70% | 71% | 70% | |||
| Education of completing high school or higher | 68% | 69% | 68% | |||
| Unemployed | 45% | 34% | 57% | |||
| Not married nor living with partner | 59% | 70% | 48% | |||
| Sexually active** | 70% | 63% | 78% | |||
| >2 sex partners** | 10% | 17% | 3% | |||
| Consistent condom use** | 19% | 20% | 17% | |||
*Weighted analysis
**In the 6 months prior to pre-cohort survey interview
Weighted analysis, which allows Cohort 1 data to be generalized to the national population, indicates that the mean age of HIV-uninfected adults in Swaziland in 2011 was 28 years and that 70% percent lived in rural areas [Table 1]. Sixty eight percent had a secondary education or higher, and almost half were unemployed (34% of men and 57% of women). Seventy percent of men and 48% of women were not married nor living with a partner. Sixty three percent of men and 78% of women reported being sexually active in the previous six months with 17% of men and three percent of women reporting two or more sexual partners in this time period. Among persons reporting being sexually active in the prior six months, approximately 20% of both men and women reported consistent condom use.
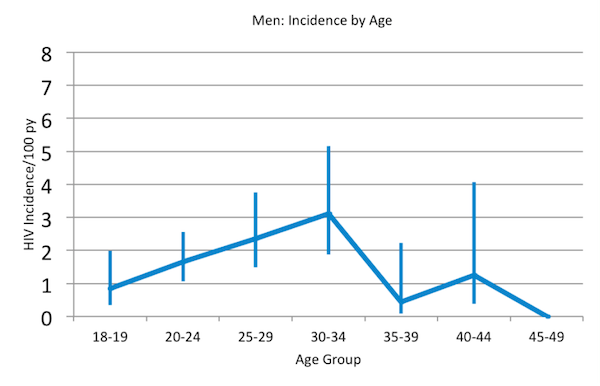
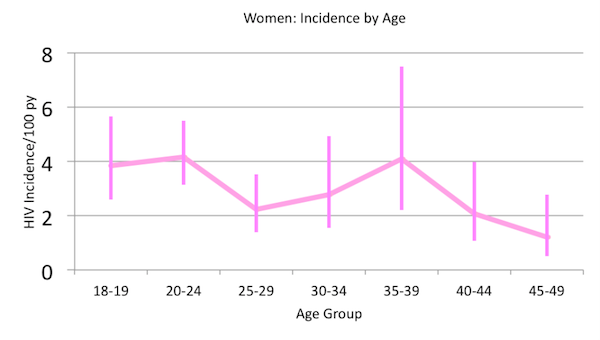
The overall incidence measurement was 2.4/100 PY. Incidence among men was 1.7/100 PY, and was almost twice as high among women at 3.1/100 PY [Table 2]. The patterns of HIV incidence for men and women were quite different with a peak of 3.1/100 PY in men aged 30-34, and two peaks seen in women at ages 20-24 and 35-39 of 4.2/100 PY and 4.1/100 PY respectively [Figure 1]. Among women, incidence was higher in those not married nor living with a partner (4.1/100 PY), those with 2 or more partners (9.6/100 PY) (which was only three percent of the study population), and reporting pregnancy (4.4/100 PY). Among men, incidence was higher in those not married nor living with a partner (1.8/100 PY), reporting inconsistent condom use (2.7/100 PY), those with 2 or more partners (3.2/100 PY), and those who were uncircumcised (1.7/100 PY) [Table 3].
Table 2: HIV Incidence in Swaziland
| Sero- conversions | Person years (PY) of Follow-up | Incidence/ 100 PY | 95% CI Incidence/ 100 PY | |||||
|---|---|---|---|---|---|---|---|---|
| Overall | 143* | 6019 | 2.38 | 2.06-2.75 | ||||
| Men | 51 | 3070 | 1.65 | 1.28-2.11 | ||||
| Women | 93 | 2949 | 3.14 | 2.63-3.74 | ||||
*Columns will not sum due to sample weighting
HIV Incidence in Swaziland by Age and Sex (95% confidence intervals represented with vertical bars)


The multivariable model, adjusted for education, employment, geography, number of sex partners, and pregnancy, showed that independent predictors of seroconversion among women were age (20-24, HR 2.03, 95% CI 1.01-4.05; 35-39 HR 2.85, 95% CI 1.02-7.98), not being married nor living with a partner (HR 3.05, 95% CI 1.64-5.69), having a partner that lived elsewhere (HR 2.81, 95%CI 1.53-5.15), and having an HIV positive partner (HR 1.88, 95% CI 1.09-3.27) or a partner of unknown HIV status (HR 2.74, 95% CI 1.53-4.92). Among men, significant predictors of seroconversion included not knowing a partner’s HIV status (HR 3.72, 95% CI 1.97-7.05) and inconsistent condom use (HR 2.35, 95% CI 1.16-4.73).
Table 3: HIV Incidence by Demographics and Behaviors
| Men | Women | |||||||
|---|---|---|---|---|---|---|---|---|
| Incidence/ 100 PY | 95% CI | Incidence/ 100 PY | 95% CI | |||||
Marital Status |
||||||||
| Married/living together | 1.34 | (0.79-2.27) | 2.24 | (1.52-3.02) | ||||
| Not married/not living together | 1.80 | (1.36-2.38) | 4.06 | (3.28-5.03) | ||||
Condom Use, past 6 months* |
||||||||
| Consistent use | 1.74 | (1.05-2.89) | 3.78 | (2.65-5.37) | ||||
| Inconsistent use | 2.70 | (2.01-3.61) | 3.78 | (3.03-4.66) | ||||
# Sex Partners, past 6 months |
||||||||
| Never had sex | 0.15 | (0.03-0.83) | 0.71 | (0.22-2.26) | ||||
| 0 | 0.40 | (0.08-2.05) | 1.21 | (0.61-2.38) | ||||
| 1 | 1.92 | (1.40-2.64) | 3.64 | (3.01-4.41) | ||||
| > 2 | 3.21 | (2.02-5.10) | 9.64 | (4.48-20.0) | ||||
MC Status, self report |
||||||||
| Circumcised | 1.29 | (0.71-2.33) | NA* | |||||
| Uncircumcised | 1.74 | (1.32-2.30) | NA* | |||||
Pregnant, self report |
NA* | – | 4.38 | (1.86-10.1) | ||||
*Among participants reporting sexual activity
